The daily positive COVID-19 infection rate of those tested in Connecticut held steady at 3.55 percent over the weekend beginning on Friday, Aug. 13, with 26 new patients being treated statewide as the total rose to 285 as of Monday, Aug. 16.
A week ago, approximately 160 COVID-19 patients were being treated for the virus.
Over the weekend, Connecticut Gov. Ned Lamont said that there were 44,577 new COVID-19 tests administered statewide, resulting in a total of 1,581 laboratory-confirmed infections. There have now been a total of 363,417 cases reported since the pandemic began in March 2020.
The Delta variant of COVID-19 continues to be the dominant strain in Connecticut, now accounting for more than 80 percent of all new infections, officials noted. In the past week, the number of cases of the Delta variant is also up hundreds over the past several weeks.
Since the pandemic began in March 2020, there have been more than 8,300 COVID-19 fatalities in Connecticut.
According to the latest data from the state Department of Health, there have now been 2,389,092 first COVID-19 vaccine doses administered in Connecticut, with 2,195 completing the vaccination process, among the highest rates per capita in the country.
First dose coverage, by age, according to the most recent data from the state Department of Health:
- 65+: 97 percent;
- 55-64: 87 percent;
- 45-54: 77 percent;
- 35-44: 75 percent;
- 25-34: 66 percent;
- 18-24: 63 percent;
- 16-17: 72 percent;
- 12-15: 58 percent.
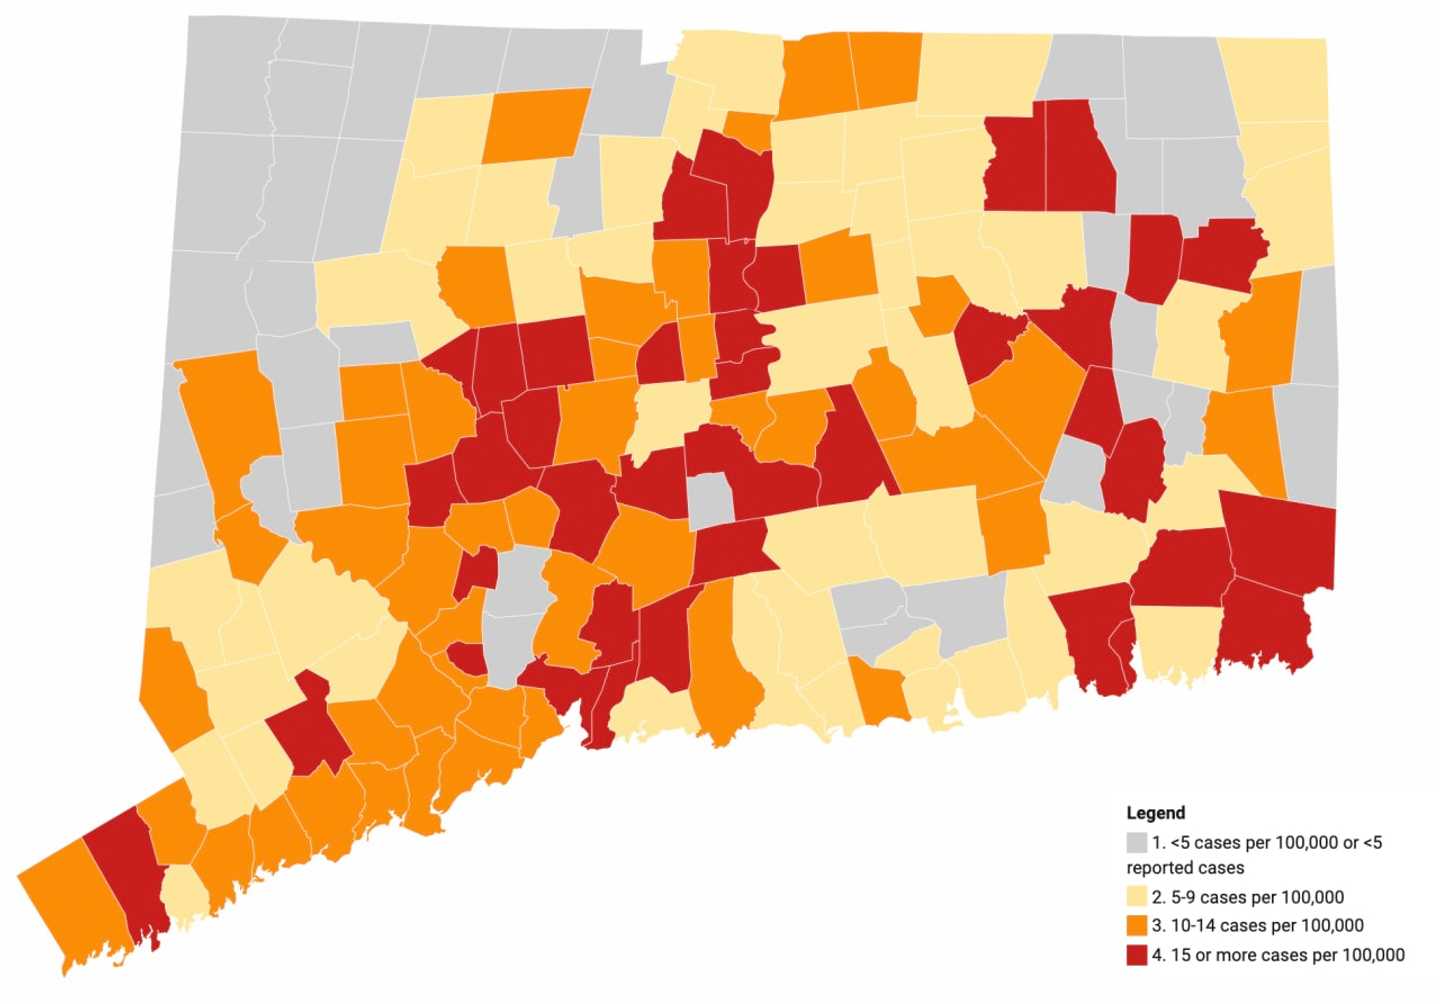
The latest breakdown of confirmed and probable COVID-19 cases in Connecticut, by county, according to the state Department of Health on, Aug. 16:
- Fairfield: 103,462 (10,968 per 100,000 residents);
- New Haven: 95,700 (11,196);
- Hartford: 88,038 (9,873);
- New London: 23,561 (8,884);
- Litchfield: 15,149 (8,401);
- Middlesex: 13,406 (8,253);
- Windham: 11,278 (9,657);
- Tolland: 10,026 (6,652).
A complete list of cases, by communities, can be found here by clicking and scrolling down.
Click here to follow Daily Voice Litchfield and receive free news updates.