In his latest COVID-19 briefing, Connecticut Gov. Ned Lamont said that there were 37,791 COVID-19 tests administered in the state on Thursday, Feb. 11, resulting in 838 newly confirmed cases.
The 2.22 percent infection rate is down from 2.32 percent the previous day and is now the lowest in Connecticut since before Thanksgiving.
Twenty-seven new COVID-19-related deaths were reported in Connecticut on Thursday, bringing the death toll to 7,381 since the pandemic began nearly a year ago.
Lamont said that 57 COVID-19 patients were discharged from Connecticut hospitals, leaving 674 still being treated. There have now been a total of 267,337 COVID-19 cases confirmed statewide since March out of nearly 6.2 million tested.
Lamont said that the state is receiving 69,000 COVID-19 vaccination first doses next week for more than 300,000 Connecticut residents who will be newly eligible.
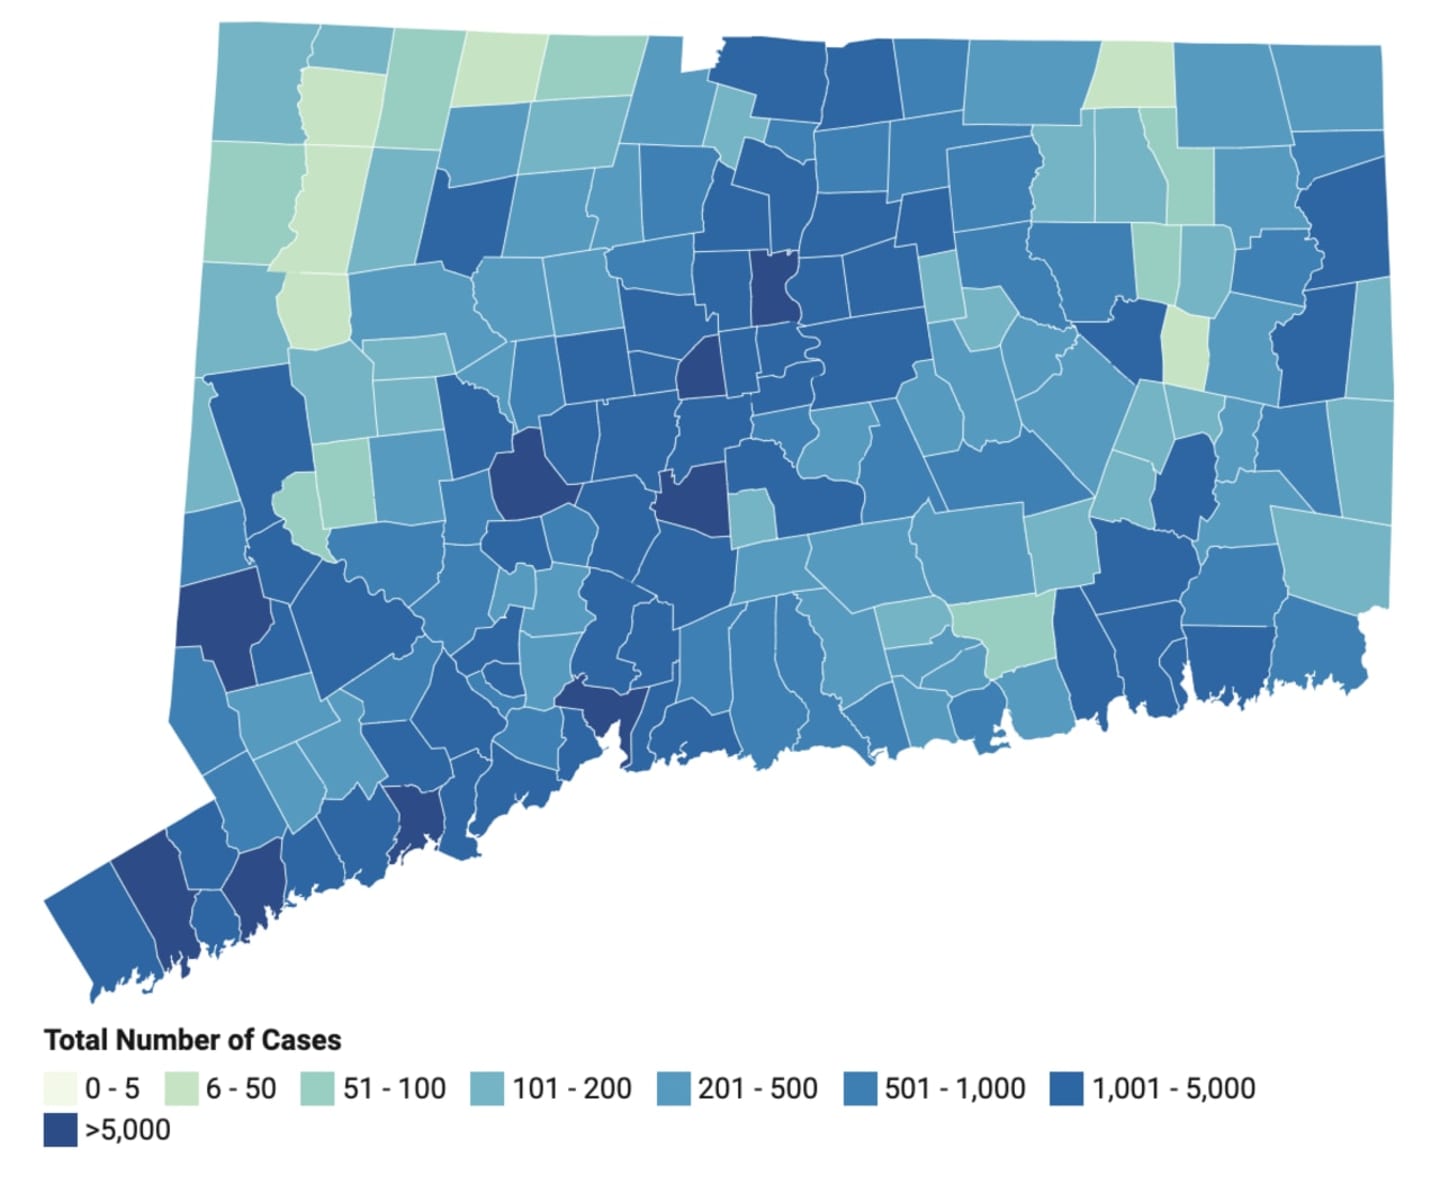
The latest breakdown of confirmed and probable COVID-19 cases in Connecticut, by county, according to the state Department of Health on Thursday, Feb. 11:
- Fairfield: 76,266;
- New Haven: 67,380;
- Hartford: 67,142;
- New London: 18,152;
- Litchfield: 10,569;
- Middlesex: 9,837;
- Windham: 8,834;
- Tolland: 7,421;
- Unknown: 898.
A complete list of cases, by communities, can be found here by clicking and scrolling down
Click here to follow Daily Voice Litchfield and receive free news updates.