
In the past week, Connecticut hospitals recorded 56 new virus-related deaths, bringing the total as of Thursday, Dec. 16 to 9,002 statewide since the pandemic began in March 2020.
On Wednesday, Dec. 15, there were 29,187 COVID-19 tests administered in Connecticut, resulting in 2,085 laboratory-confirmed cases of the virus for a 7.14 percent daily positive infection rate, down slightly from the previous day.
Connecticut Gov. Ned Lamont said that the state Department of Public Health identified 29 new cases of the Omicron variant, bringing the total to 40 confirmed infections statewide since it began spreading.
Six more COVID-19 patients were discharged from Connecticut hospitals, bringing the total being treated down to 710.
Connecticut continues to be among the quickest states to roll out their COVID-19 vaccines, with 2,811,757 first doses administered as of Dec. 16, while 2,545,140 have completed the vaccination process with both shots.
"Stay safe," Lamont said. "The best thing you can do to protect yourself and your loved ones is to get your vaccine and get your booster."
A breakdown of which populations have received the most vaccines, by age group on Dec. 16:
- 65+: >95 percent
- 55-64: 95 percent;
- 45-54: 87 percent;
- 35-44: 88 percent;
- 25-34: 81 percent;
- 18-24: 74 percent;
- 16-17: 82 percent;
- 12-15: 74 percent;
- 5-11: 30 percent.
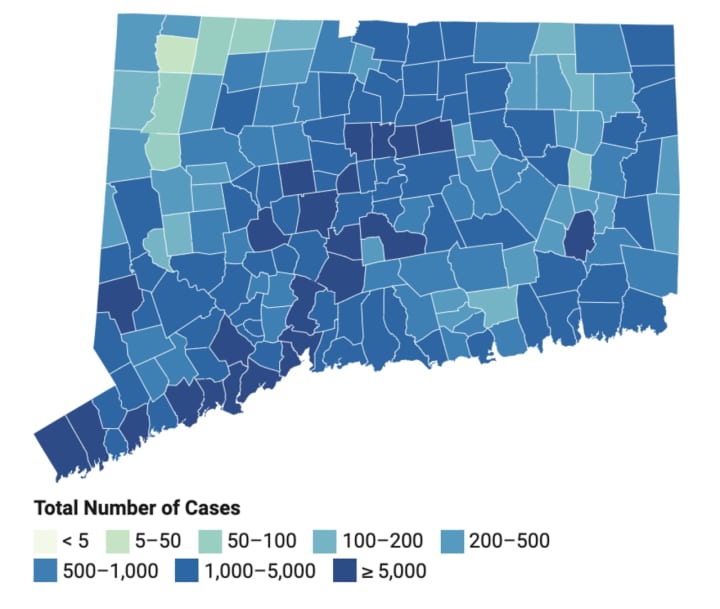
The latest breakdown of confirmed COVID-19 cases and deaths in Connecticut since March 2020, by county:
- Fairfield: 122,366 (2,336 deaths);
- New Haven: 117,870 (2,310);
- Hartford: 111,000 (2,642);
- New London: 32,578 (513);
- Litchfield: 20,198 (354);
- Middlesex: 16,939 (403);
- Windham: 16,237 (239);
- Tolland: 13,242 (205).
A complete list of cases, by communities, can be found here by clicking and scrolling down.
Click here to follow Daily Voice Danbury and receive free news updates.