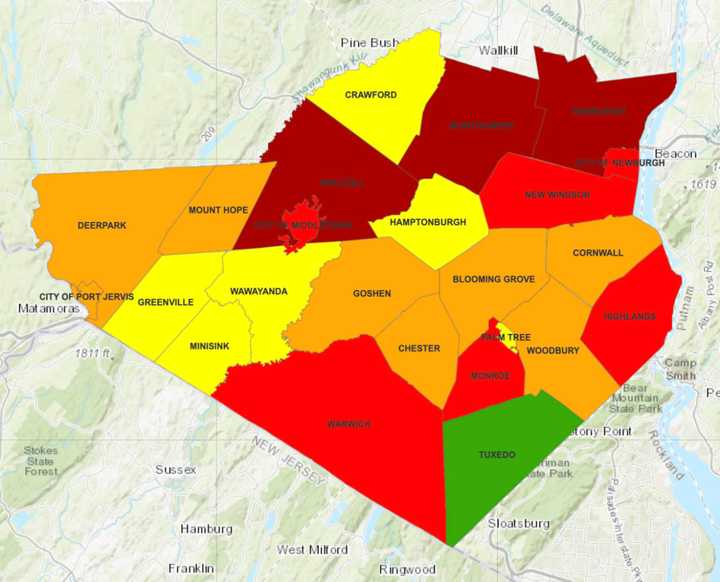
The number of active cases is up to 2,427, up nearly 1,000 from one month ago, according to the county Department of Health. Newly confirmed fatalities brought the death toll up to 774 as of Tuesday, March 30.
A total of 122 COVID-19 patients are being treated in Orange County hospitals.
Since the pandemic began, a total of 42,769 COVID-19 cases have been confirmed out of 642,254 tests administered in Orange County.
The overall positive infection rate in Orange County rose slightly from 6.6 percent to 6.7 percent, still among the highest in the Hudson Valley.
A breakdown of Orange County COVID-19 cases in Orange County on March 30:
- Wallkill: 279;
- Newburgh: 216;
- Montgomery: 210;
- City of Middletown: 199;
- New Windsor: 195;
- Warwick: 187;
- City of Newburgh: 172;
- Monroe: 145;
- Highlands: 107;
- Chester: 88;
- Woodbury: 88;
- Blooming Grove: 74;
- Deerpark: 66;
- Cornwall: 63;
- Goshen: 60;
- City of Port Jervis: 59;
- Mount Hope: 53;
- Greenville: 46;
- Wawayanda: 46;
- Crawford: 43;
- Palm Tree: 34;
- Minisink: 26;
- Tuxedo: 15.
Statewide, a total of 1,843,562 positive COVID-19 cases have been confirmed out of 44.56 million tests that have been administered. There have been a total of 40,390 virus-related deaths since the beginning of the pandemic.
Click here to follow Daily Voice Newburgh and receive free news updates.

