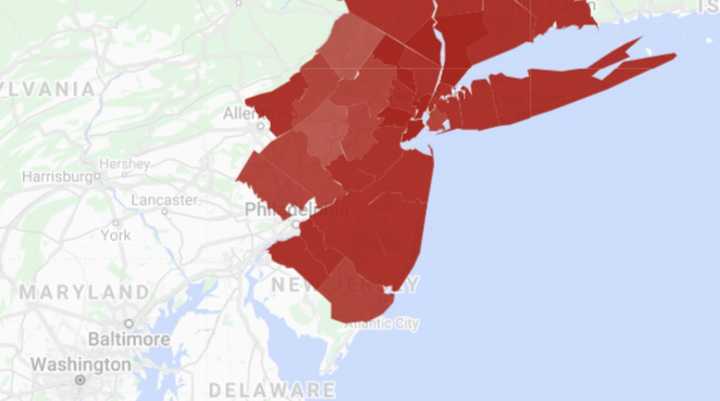
The color of each county on the map is determined by the density of cases, ie. the number of cases per 10,000 population.
The tracker also includes updates on ICU bed capacity.
Click each county on the map for details. Bookmark this page and check back here for ongoing updates.
Sources:
- https://www1.nyc.gov/site/doh/health/health-topics/coronavirus.page
- https://coronavirus.health.ny.gov/county-county-breakdown-positive-cases
- https://www.nj.gov/health/cd/topics/covid2019_dashboard.shtml
- https://portal.ct.gov/coronavirus
- https://www.mass.gov/info-details/covid-19-response-reporting (Note that Massachusetts reports number by county once a week)
- https://www.health.pa.gov/topics/disease/coronavirus/Pages/Coronavirus.aspx
- https://carlsonschool.umn.edu/mili-misrc-covid19-tracking-project (Note that this percentage is updated once a week)
Click here to follow Daily Voice Cherry Hill and receive free news updates.
