In the past week, Connecticut hospitals recorded 31 new virus-related deaths, bringing the total up to 8,447 statewide as of Thursday, Sept. 16, as the infection rate is back on the rise.
The daily positive COVID-19 infection rate of those tested in Connecticut has been fluctuating in the past week, from above 4 percent, back below 3 percent, before settling at 2.95 percent on Wednesday, Sept. 15.
On Sept. 15, Connecticut Gov. Ned Lamont said that there were 36,180 COVID-19 tests administered statewide, resulting in 1,066 laboratory-confirmed cases of the virus.
Three more COVID-19 patients were discharged from Connecticut hospitals, bringing the total being treated down to 325. Of those 325 hospitalized patients, 237 (72.9 percent) are unvaccinated.
The Delta variant of COVID-19 continues to be the dominant strain in Connecticut, now accounting for more than 95 percent of all new infections, officials noted.
Connecticut continues to be among the quickest in administering the COVID-19 vaccine, with 2,497,600 residents receiving at least one shot, while 2,301,938 have completed the vaccination process.
In total, 2,438,692 first doses have been administered, while 2,239,666 in Connecticut have completed the vaccination process.
A breakdown of which populations have received the most vaccines, by age group on Sept. 16:
- 65+: 97 percent
- 55-64: 89 percent;
- 45-54: 80 percent;
- 35-44: 79 percent;
- 25-34: 71 percent;
- 18-24: 67 percent;
- 16-17: 77 percent;
- 12-15: 67 percent.
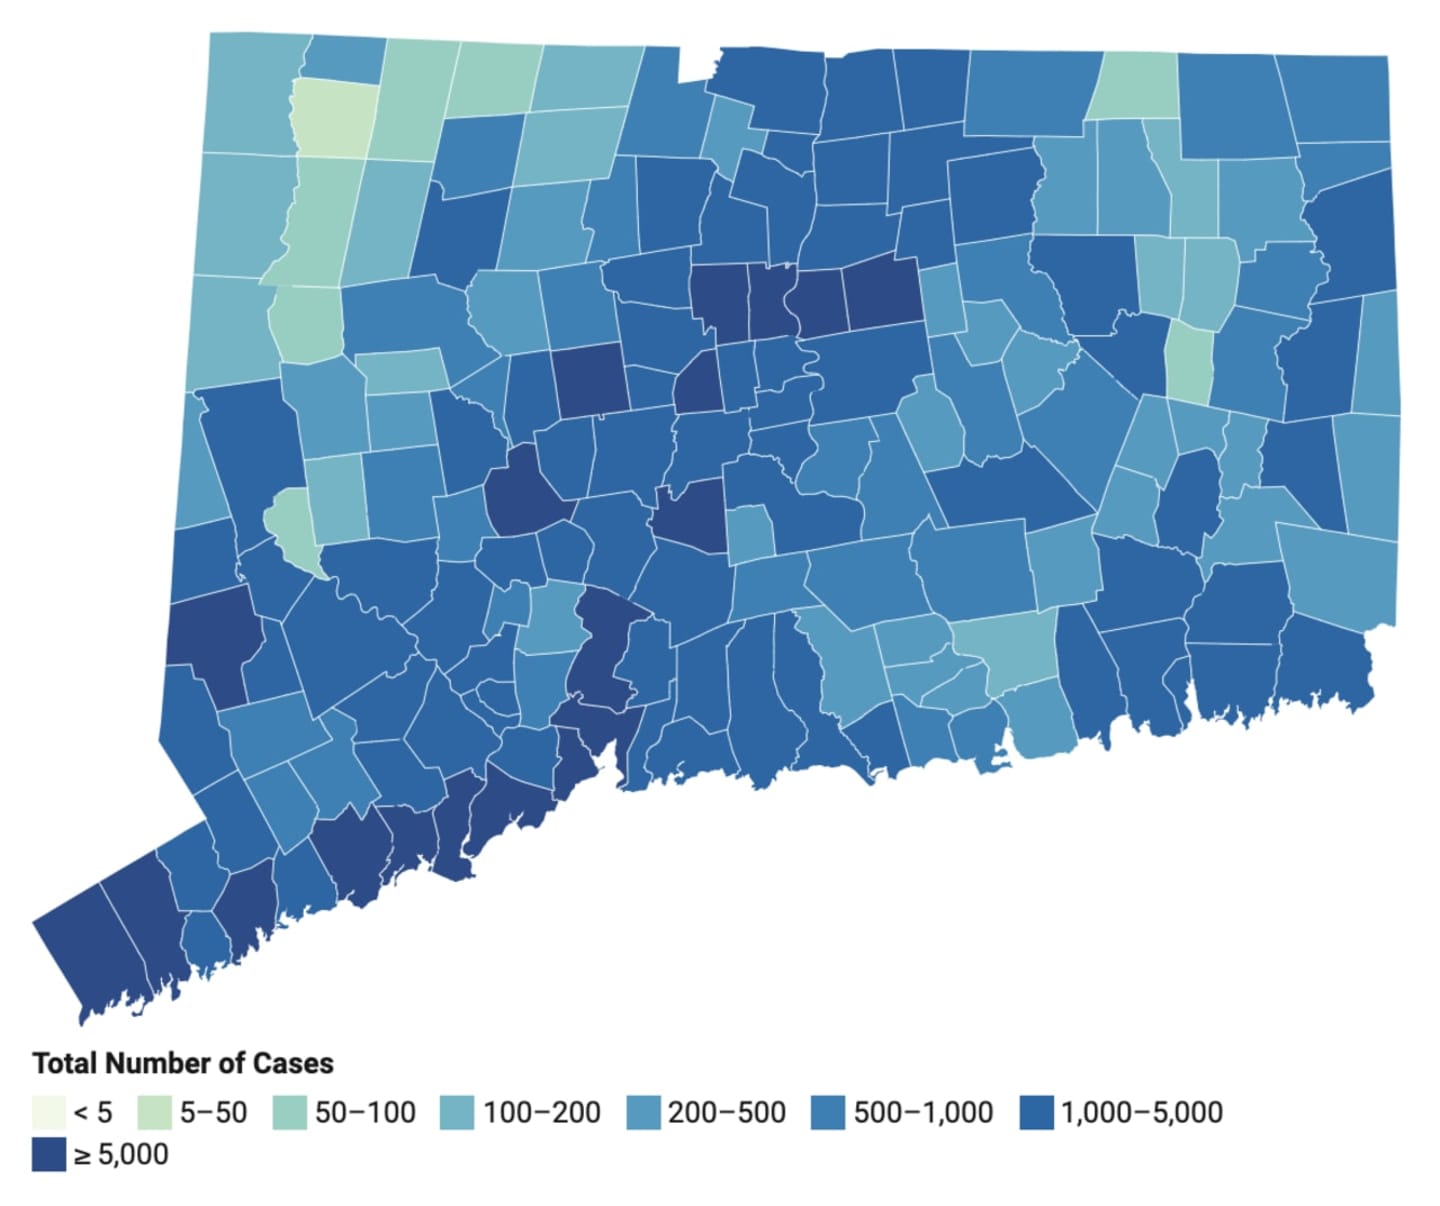
The latest breakdown of confirmed and probable COVID-19 cases in Connecticut, by county, according to the state Department of Health on Sept. 16:
- Fairfield: 107,929 (11,441 per 100,000 residents);
- New Haven: 100,839 (11,797);
- Hartford: 93,206 (10,452);
- New London: 25,576 (9,644);
- Litchfield: 16,108 (8,932);
- Middlesex: 14,146 (8,709);
- Windham: 11,969 (10,249);
- Tolland: 10,663 (7,075).
A complete list of cases, by communities, can be found here by clicking and scrolling down.
Click here to follow Daily Voice Litchfield and receive free news updates.