That’s about 6,523 vaccines per 100,000 people, according to Sunday, Jan. 10, data provided by the U.S. Centers for Disease Control and Prevention, the most recent information available.
Massachusetts is among the states with the most vaccines distributed - it’s also one of the states that have been hit the hardest by COVID-19. Other states where vaccines are rolling out more quickly than other parts of the country include Connecticut, New York, Vermont, New Hampshire, Rhode Island, and Maine.
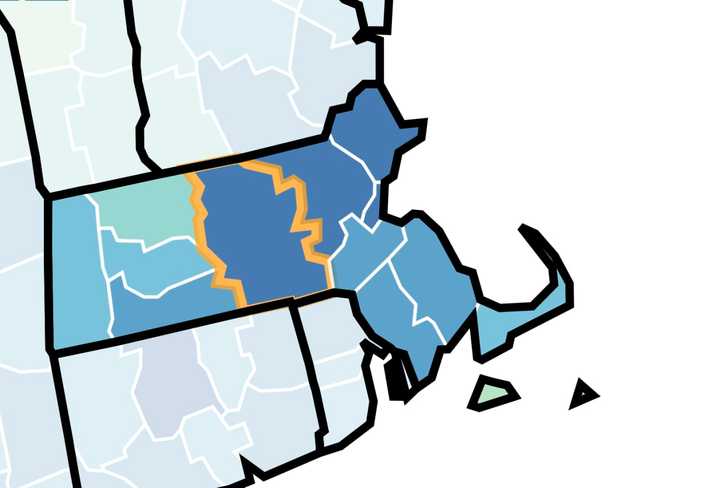
Meanwhile, the number of COVID-19 cases reported is spiking in Central and Western Massachusetts counties. The ones with the sharpest rises are the Berkshires where the 7-day average, new COVID-19 cases reported went up by more than 67 percent from the week of Dec. 28 to Jan. 2.
Over the same time period, Franklin County’s 7-day average went up by 41 percent from week to week, Hampshire is up by 40 percent, Hampden is up by 48 percent, and Worcester County experienced the smallest increase, locally, with 32 percent more cases reported compared with the previous seven days.
Click here to follow Daily Voice Springfield and receive free news updates.
