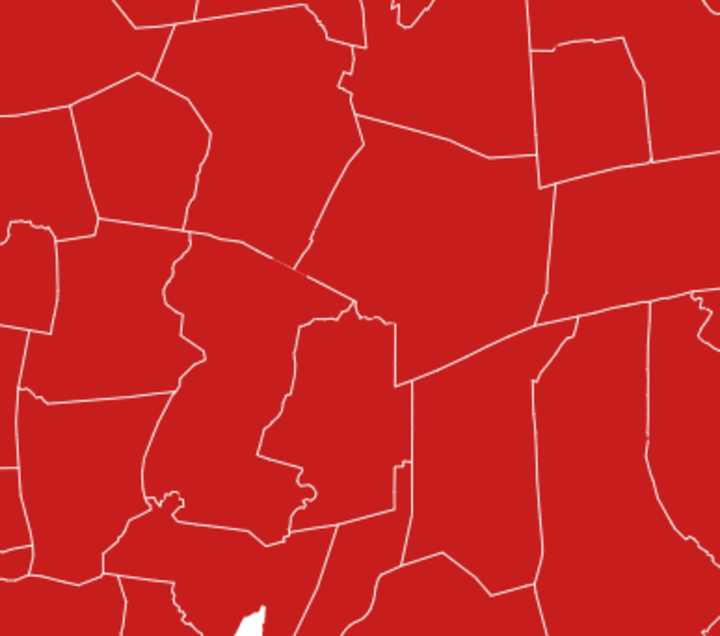
There are now 157 out of 179 Connecticut cities and towns that have turned “red” due to COVID-19 incident rates.
Last week, Nov. 12, there were 100 red communities. Many of the new additions are from the New Haven area.
Red communities are so-called due to the state’s color-coded map of average daily COVID-19 cases. Red communities are reporting 4-15 or more cases per 100,000 residents.
Scroll down for local city and town rates and trends.
Red communities are so-called due to the state’s color-coded map of average daily COVID-19 cases. Red communities are reporting 4-15 or more cases per 100,000 residents.
The 22 communities that aren’t in the red are Sharon (2.6), Cornwall (10.4), Warren (0), Canaan (0), Norfolk (0), Colebrook (10.2), Hartland (6.7), Bridgewater (17.4), Lyme (6.1), Scotland (8.5), Eastford (8), Union (0), Winchester (14.1), Barkhamsted (13.8), Granby (10), Canton (11.8), Simsbury (11.7), Avon (14), Ellington (14.9), Stafford (10.2), Bolton (14.6), Columbia (14.6).
Some of those communities are “orange,” meaning that there are 10-14 cases per 100,000 people there. Orange communities are Winchester, Barkhamsted, Granby, Canton, Simsbury, Avon, Ellington, Stafford, Bolton, and Columbia.
In Connecticut, like many other states, COVID-19 is surging due to decreased economic restrictions, the return of students to classrooms in September, and what some refer to as people dropping their vigilance. The state has instituted a 9:30 p.m. curfew and rolled back some of the economy’s reopening to tamp down on the spread of the virus.
There are no cities or towns that came off the red list from last week, Nov. 12.
The following is a list of red communities in New Haven County as of Thursday, Nov. 19, and their corresponding average daily rates. If a town was on the red list last week, the Nov. 12 rate is given as well in parentheses (). Newly added communities are in CAPS. The rates for every community on the list have gone up since Nov. 12:
ANSONIA 52.3
BEACON FALLS 53.1
BETHANY 24.8
BRANFORD 25
DERBY 57.6
EAST HAVEN 33.8
GUILFORD 16.7
HAMDEN 52.2
MADISON 23.7
MERIDEN 74.9
MIDDLEBURY 31.4
MILFORD 28.4
NAUGATUCK 57.5
NEW HAVEN 31.1
NORTH BRANFORD 24.7
NORTH HAVEN 33.2
ORANGE 24.1
OXFORD 29.2
PROSPECT 56.2
SEYMOUR 51.1
SOUTHBURY 28.3
WALLINGFORD 57.3
WATERBURY 65.9
WEST HAVEN 32.3
WOODBRIDGE 17.
Click here to follow Daily Voice New Haven and receive free news updates.


