
There are now 157 out of 179 Connecticut cities and towns that have turned “red” due to COVID-19 incident rates.
Last week, Nov. 12, there were 100 red communities.
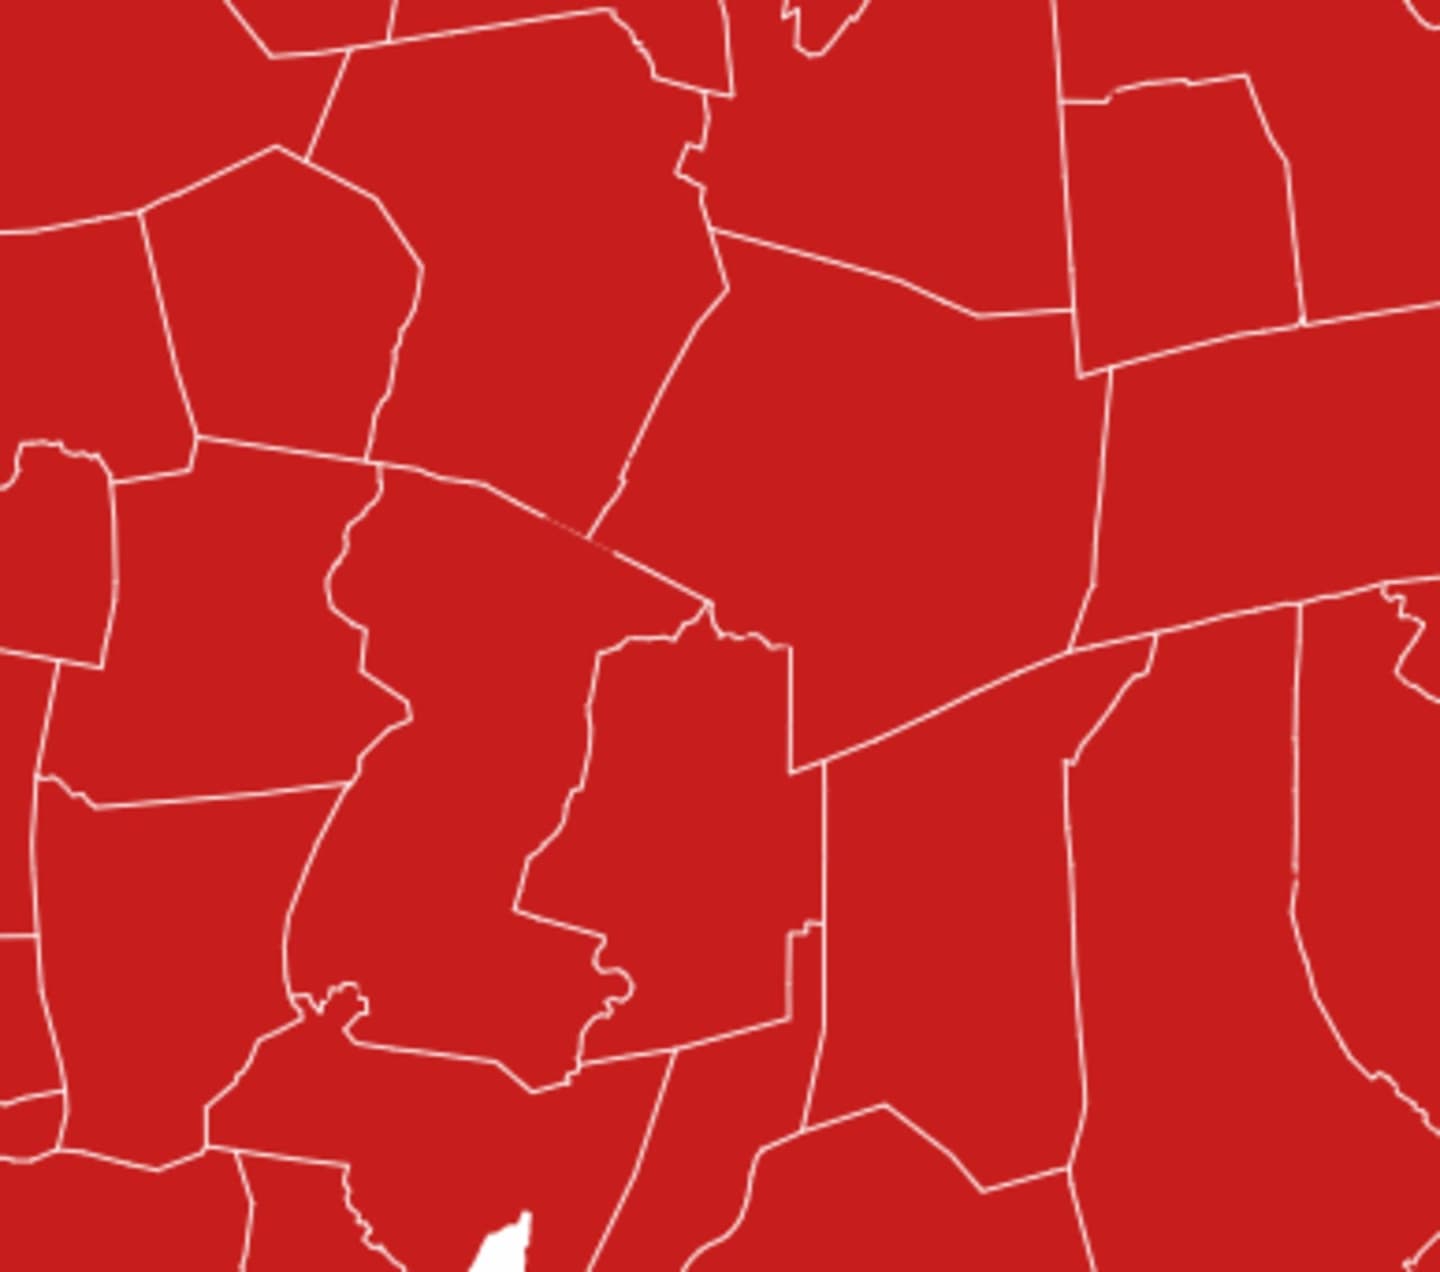
Red communities are so-called due to the state’s color-coded map of average daily COVID-19 cases. Red communities are reporting 4-15 or more cases per 100,000 residents.
Scroll down for local city and town rates and trends.
Red communities are so-called due to the state’s color-coded map of average daily COVID-19 cases. Red communities are reporting 4-15 or more cases per 100,000 residents.
The 22 communities that aren’t in the red are Sharon (2.6), Cornwall (10.4), Warren (0), Canaan (0), Norfolk (0), Colebrook (10.2), Hartland (6.7), Bridgewater (17.4), Lyme (6.1), Scotland (8.5), Eastford (8), Union (0), Winchester (14.1), Barkhamsted (13.8), Granby (10), Canton (11.8), Simsbury (11.7), Avon (14), Ellington (14.9), Stafford (10.2), Bolton (14.6), Columbia (14.6).
Some of those communities are “orange,” meaning that there are 10-14 cases per 100,000 people there. Orange communities are Winchester, Barkhamsted, Granby, Canton, Simsbury, Avon, Ellington, Stafford, Bolton, and Columbia.
In Connecticut, like many other states, COVID-19 is surging due to decreased economic restrictions, the return of students to classrooms in September, and what some refer to as people dropping their vigilance. The state has instituted a 9:30 p.m. curfew and rolled back some of the economy’s reopening to tamp down on the spread of the virus.
There are no cities or towns that came off the red list from last week, Nov. 12.
The following is a list of red communities in Connecticut as of Thursday, Nov. 19, and their corresponding average daily rates. If a town was on the red list last week, the Nov. 12 rate is given as well in parentheses (). Newly added communities are in CAPS. The rates for every community on the list have gone up since Nov. 12:
AVON 14
Berlin 31.5 (16.8)
Bloomfield 26.5 (17.8)
Bristol 40.6 (17)
BURLINGTON 18.5
CANTON 11.8
East Hartford 51.4 (29.3)
East Windsor 33.9 (22)
ENFIELD 23.8
FARMINGTON 17.6
GLASTONBURY 18.4
GRANBY 10
Hartford 62 (41.3)
Manchester 28.3 (18.6)
MARLBOROUGH 30.3
New Britain 59.5 (38)
Newington 46.5 (28)
Plainville 43 (25.1)
Rocky Hill 32.6 (16.7)
SIMSBURY 11.7
SOUTH WINDSOR 26.6
Southington 43.4 (31)
SUFFIELD 32.2
West Hartford 23.6 (15.8)
Wethersfield 37.5 (22.5)
Windsor 39.2 (26.6)
Windsor Locks 30.5 (15).
Didn’t see your community? Check out the full map and data at Connecticut's Data Tracker.
Click here to follow Daily Voice Hartford and receive free news updates.