There were 13,749 COVID-19 tests administered statewide on Tuesday, Sept. 14, resulting in 401 new laboratory-confirmed infections for a 2.92 percent daily positive infection rate. The latest figure came a day after the state reported a 4.21 infection rate, among the highest since the numbers began plateauing in Connecticut toward the end of the summer.
A total of 10 more COVID-19 patients - six of whom were vaccinated - were discharged from Connecticut hospitals, bringing the total to 328 being treated statewide.
Of the 328 patients that are hospitalized, 240 are not fully vaccinated, representing 73.2 percent of all hospitalizations.
Officials noted that the Delta variant continues to be the dominant strain of the virus, accounting for more than 95 percent of all new infections.
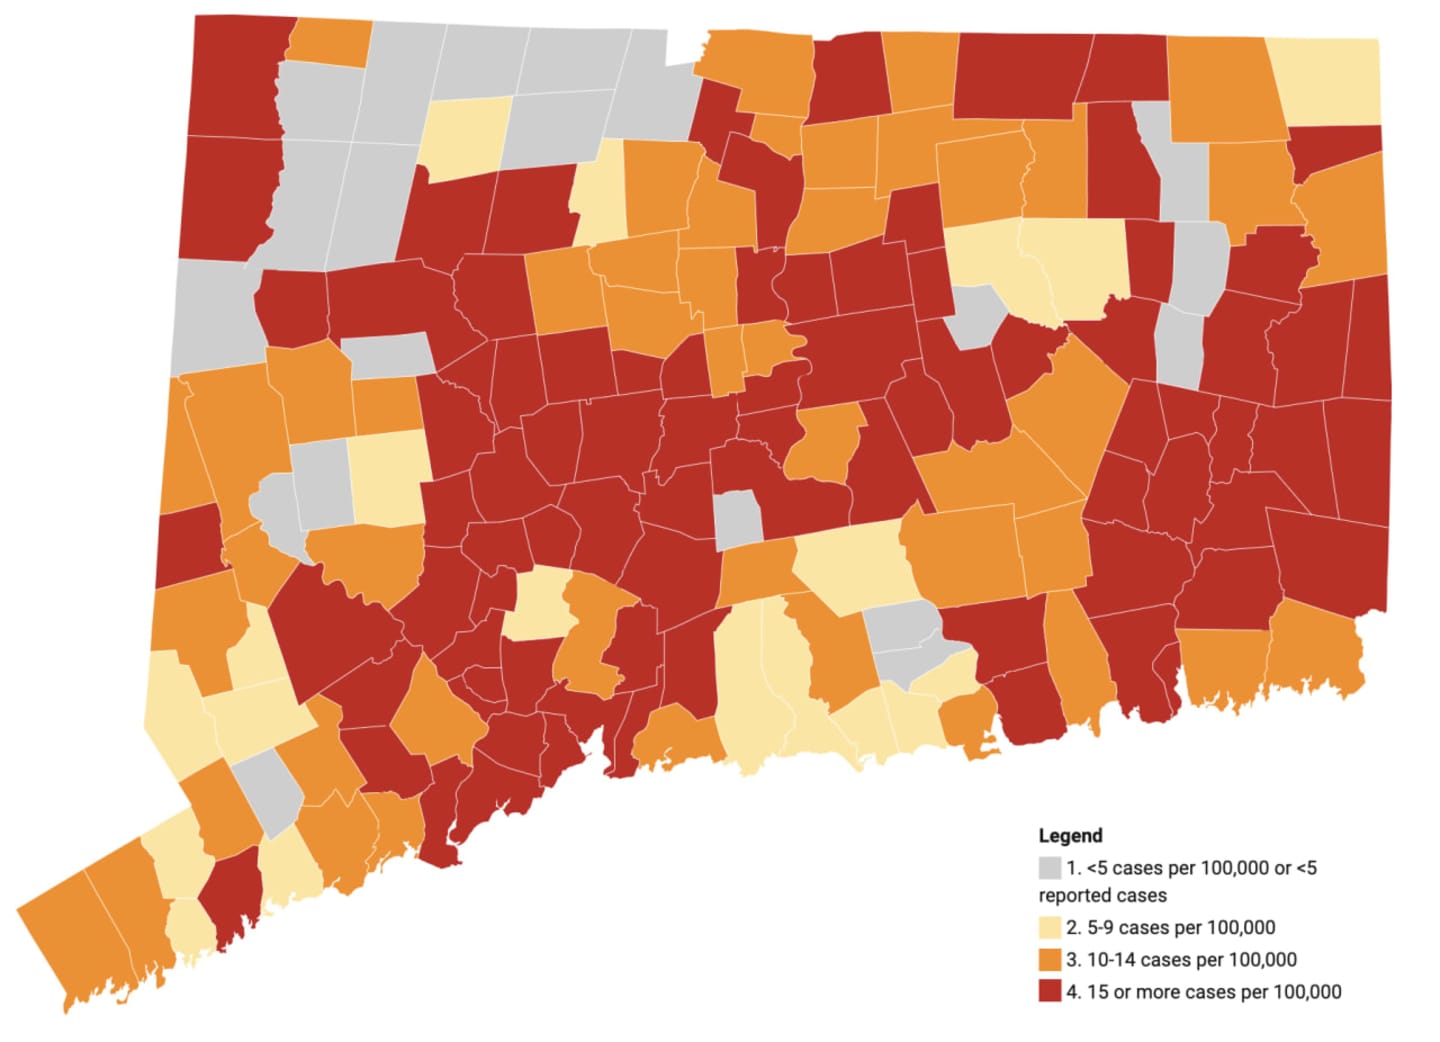
The CDC currently lists four Connecticut counties in the “high transmission” category of COVID-19 including New Haven, Windham, Litchfield, and New London counties.
Fairfield, Middlesex, Hartford, and Tolland counties are all at "substantial risk" to spread the virus.
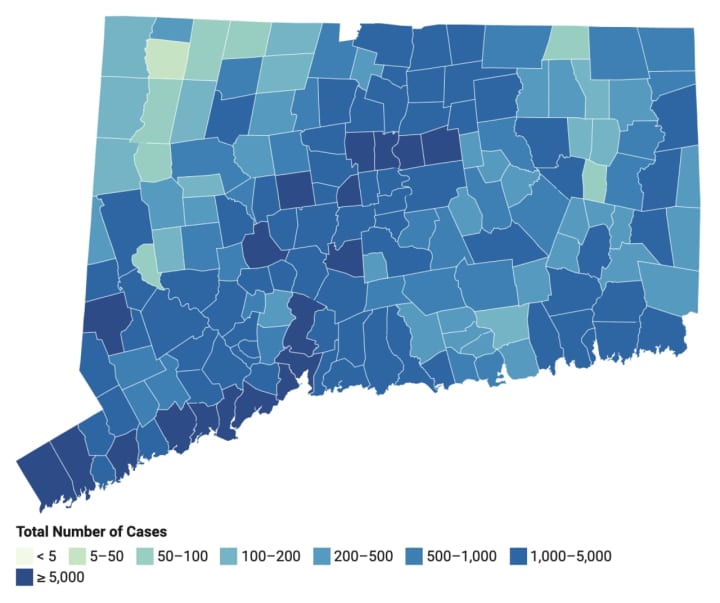
The latest breakdown of confirmed and probable COVID-19 cases in Connecticut, by county, according to the state Department of Health on Wednesday, Sept. 15:
- Fairfield: 107,840 (11,432 per 100,000 residents);
- New Haven: 100,676 (11,778);
- Hartford: 93,154 (10,447);
- New London: 25,533 (9,628);
- Litchfield: 16,093 (8,924);
- Middlesex: 14,126 (8,696);
- Windham: 11,956 (10,238);
- Tolland: 10,658 (7,071).
A complete list of cases, by communities, can be found here by clicking and scrolling down.
Click here to follow Daily Voice Fairfield and receive free news updates.