In the latest update from the State Department of Health, Connecticut administered 16,255 COVID-19 tests, which resulted in 754 laboratory-confirmed cases for a 4.64 percent positivity rate of those tested.
The state has been averaging more than 700 new daily COVID-19 cases over the past week-and-a-half, representing an increase of more than 100 percent over the previous two weeks.
According to the Department of Health, the number of COVID-19 patients being treated in Connecticut hospitals also continues to be on the rise, with 14 more being admitted to bring the total to 282 statewide, the most in more than a month.
A breakdown of which populations have received the most vaccines, by age group in Connecticut:
- 65+: >95 percent
- 55-64: 93 percent;
- 45-54: 84 percent;
- 35-44: 85 percent;
- 25-34: 78 percent;
- 18-24: 72 percent;
- 16-17: 81 percent;
- 12-15: 72 percent;
- 5-11: 13 percent.
Since the pandemic began in March 2020, Connecticut has administered more than 12.25 million COVID-19 tests that have resulted in 415,732 positive cases.
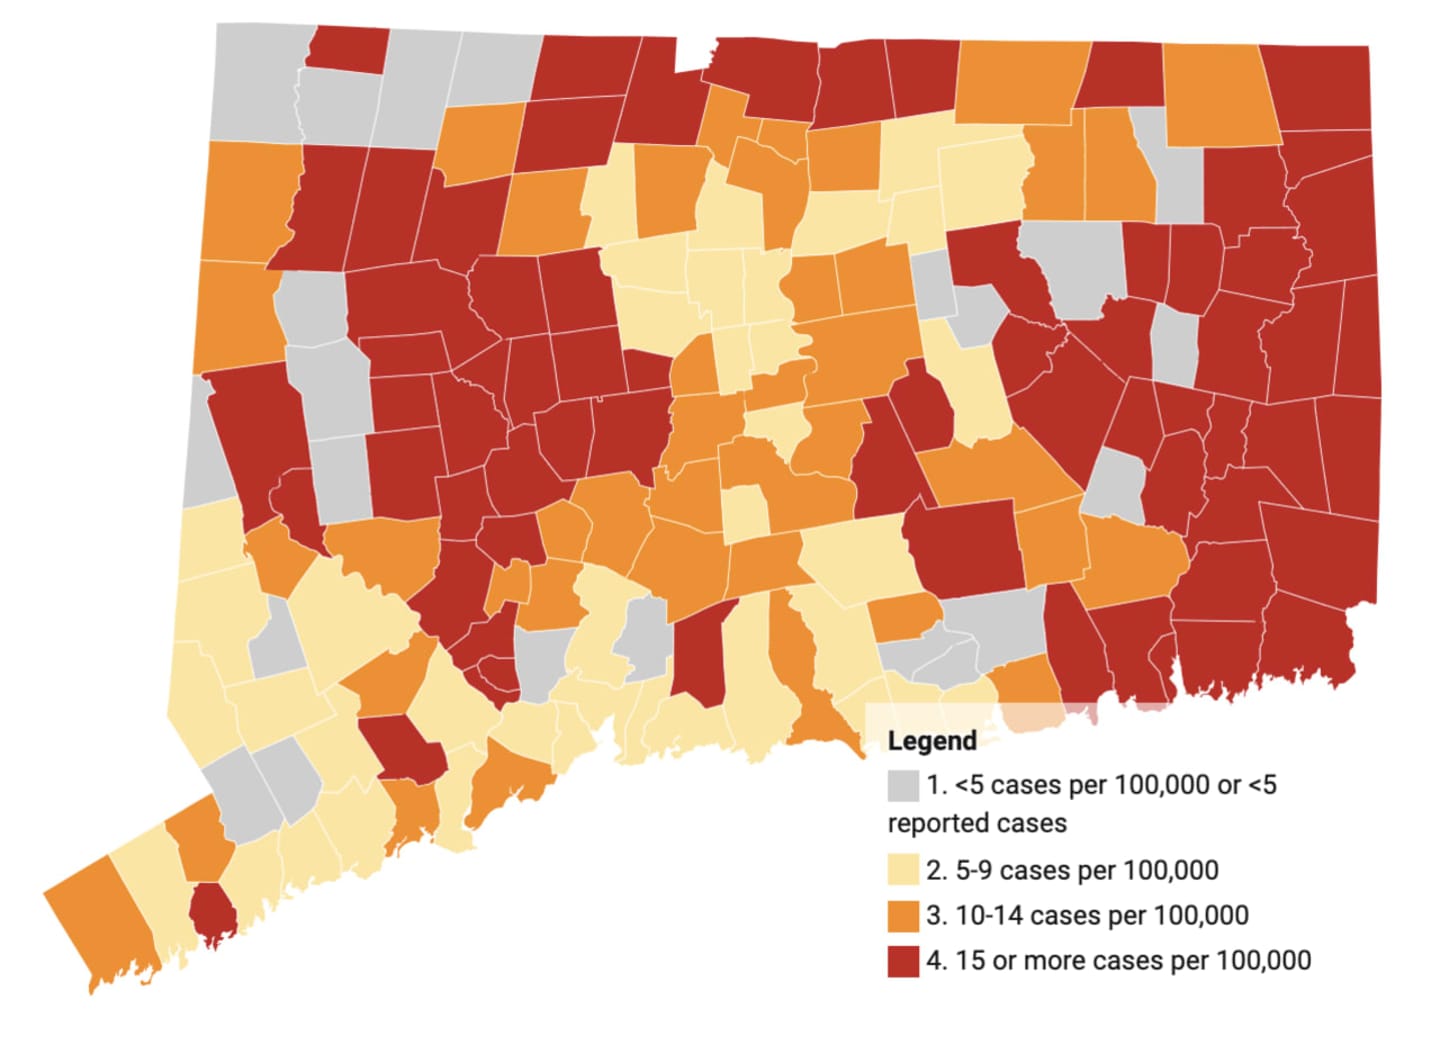
The latest breakdown of confirmed COVID-19 cases in Connecticut since the beginning of the pandemic, by county:
- Fairfield: 114,991 (12,190 per 100,000 residents);
- New Haven: 108,762 (12,724);
- Hartford: 101,728 (11,408);
- New London: 29,135 (10,986);
- Litchfield: 18,067 (10,019);
- Middlesex: 15,491 (9,537);
- Windham: 14,338 (12,278);
- Tolland: 11,820 (7,842).
A complete list of cases, by communities, can be found here by clicking and scrolling down.
Click here to follow Daily Voice Brookfield and receive free news updates.